The visual canvas for data analytics.
The collaborative workspace for modern data teams. Turn raw data into shared insight, together in real time, on a single infinite canvas.
Now in Early Access. Free forever, no credit card required.
Why FlowFrame?
Traditional BI tools force rigid, linear workflows. FlowFrame is visual, collaborative, and built for how teams actually explore data.
Old Way
Lost in nested SQL subqueries and CTEs
Waiting days for engineers to pull simple reports
Dashboards siloed in individual notebooks
No visibility into data transformation logic
Non-technical teams blocked by SQL requirement
FlowFrame Way
See your entire analysis workflow on one canvas
Collaborate live with cursors and real-time updates
Build queries with no-code or SQL, your choice
Empower non-technical teams with no-code query builder
Query, transform, and visualize in one workspace
Clarity in Three Steps
From data to insights in three simple steps
Connect Anything
Securely Link your database (PostgreSQL, BigQuery, Snowflake, etc.) or upload CSV/Parquet/Json files to start analyzing instantly in your browser.
Build Visually
Map your entire analysis as a visual flow. Drag in queries, add transforms, and build charts on one canvas. Use our no-code builder or write SQL. The choice is yours.
Collaborate & Share
Invite your team to collaborate in real-time. Add stakeholders to your workspace for secure access, or generate public links for open sharing.
A Smarter Workflow for Every Role.
Whether you build with SQL or clicks, FlowFrame empowers you to find and share insights faster.
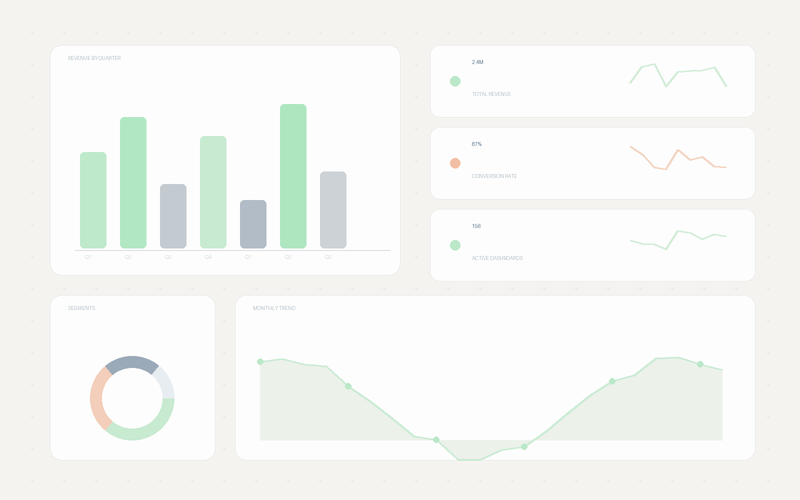
For Business Analysts
Finally, a way to move faster than the business requires. Answer complex questions without writing a line of code. Drag and drop to explore data, build interactive dashboards, and share insights in minutes, not weeks.
For Analytics Engineers
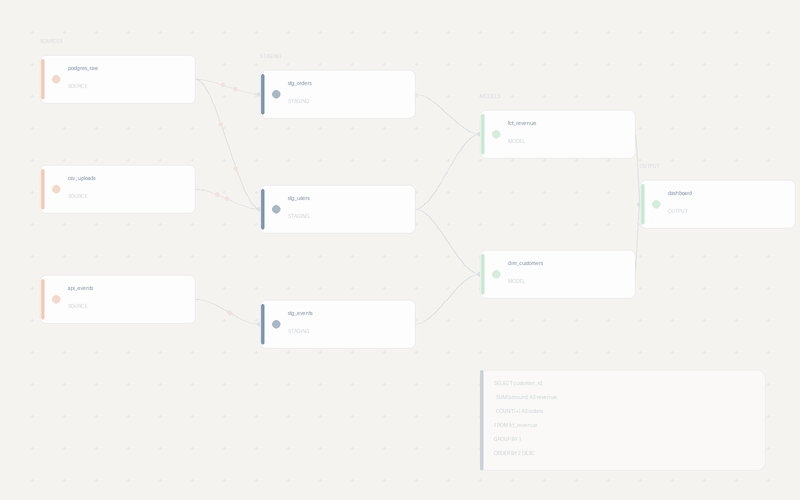
Ship faster and with fewer errors. Transform raw data into trusted models with perfect clarity. Visualize complex dependencies, version your logic, and collaborate on queries in real-time.
A Complete Data Workspace.
A complete platform for modern data workflows, from connection to collaboration, all in one place.
The Visual Canvas
See your entire data workflow at a glance. Connect nodes to transform data, create dependencies, and build interactive dashboards on an infinite, zoomable canvas.

Intuitive No-Code Builder
Empower anyone to answer data questions. Filter, join, and aggregate visually. Perfect for business analysts and non-technical team members.

Tell Compelling Stories
Go from raw numbers to beautiful, interactive charts. With a full library of chart types and deep customization, you can present your findings with clarity and impact.
AI Natural Language (Coming Soon)
We're building AI capabilities so you can ask data questions in plain English, like 'Show me revenue by region last quarter.' No SQL, no formulas. Expected launch Q2-Q3 2026.
Work Together, Instantly
Stop sending files back and forth. With Figma-style live cursors and shared workspaces, your entire team can build, edit, and analyze in perfect sync.
Create Interactive Boards
Turn static reports into dynamic tools for exploration. Add filters and date pickers to empower stakeholders to answer their own questions, live.
Connects to Your Data Stack
Native support for databases, warehouses, and file uploads
Browser-based queries powered by DuckDB-WASM
How FlowFrame compares
Weighing FlowFrame against another analytics tool? See the honest, side-by-side breakdowns.
Simple, Transparent Pricing
Start free forever. Upgrade when you need team features.
Free
For individuals and solo projects. All the core features you need to explore data and build powerful dashboards.
Unlimited personal projects
Visual no-code & pro SQL editors
Full chart & visualization library
Analyze local files (CSV, Parquet, JSON)
Lightning-fast in-browser queries
Share dashboards via public link
Pro
For growing teams who need to collaborate in real-time and connect to live databases.
Everything in Free, plus:
5 editor seats included
Additional seats: $10/user/month
Shared team workspaces & permissions
Figma-style real-time collaboration
Connect to live databases (Postgres, BigQuery & more)
Centralized, secure data sources
Automated query caching
Priority support
Unlimited viewer roles
Enterprise
For organizations that require advanced security, dedicated support, and flexible deployment options.
Everything in Pro, plus:
Single Sign-On (SSO & SAML)
Custom data source connectors
Dedicated support manager & SLAs
Advanced security & compliance features
Custom contracts & invoicing
Frequently Asked Questions
Everything you need to know about FlowFrame
PostgreSQL, MySQL, MS SQL Server, MongoDB, BigQuery, Snowflake, Redshift, and Databricks. You can also upload CSV, parquet, and json files for browser-based analysis with DuckDB-WASM.
FlowFrame uses CRDT technology (via Yjs) for true real-time collaboration with live cursors and presence, like Google Docs or Figma, but for data.
No! Use our no-code query builder to filter, join, and transform data visually. Power users can also use our SQL editor with autocomplete. We're also building AI natural language queries (coming Q2-Q3 2026) so you can ask questions in plain English like 'Show me revenue by region last quarter'.
Parameter nodes create interactive dashboards. Define parameters (date ranges, filters) and reference them in queries using {{parameter_name}}. When values change, dependent queries update automatically.
Yes! Invite stakeholders to your workspace with Explorer or Viewer roles for secure, controlled access. They log in and see exactly what you've shared. For broader distribution, you can also generate public links for read-only access, no account needed.
Team workspaces have 5 role levels: Owner, Admin, Developer, Explorer, and Viewer. Set permissions at workspace and project levels for granular access control.
7+ chart types: Line, Bar, Stacked Bar, Pie, Area, Scatter, and KPI Cards. All support extensive customization (colors, axes, labels, tooltips, legends).
Query results are cached for 5 minutes with automatic dependency tracking. Modified queries invalidate dependent queries automatically, ensuring freshness without unnecessary database hits.
Yes! Free forever with unlimited projects, all chart types, file uploads, browser-based SQL, and public sharing. Upgrade to Team for database connections and real-time collaboration.
Start building on the canvas today
Connect your data, build visually, and share insights with your team. Free forever, no setup required.
No credit card required.